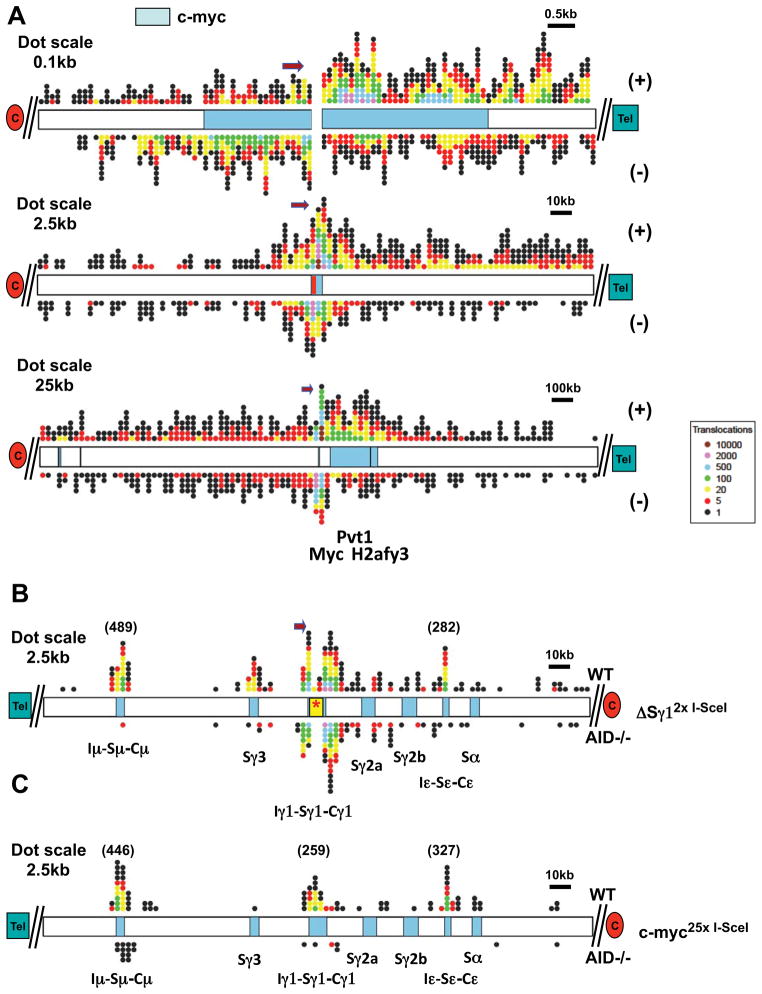
Figure 3. Distribution of IgH and c-myc breakpoint-proximal junctions.
(A) Distribution of junctions around chr15 breaksite in the pooled c-myc25xI-SceI HTGTS library. Top: 10 kb around breaksite (represented as a split). Middle: 250 kb around breaksite (represented by red bar); Bottom: 2.5 Mb around breaksite. (+) and (−)-oriented junctions are plotted on top and bottom of chromosome diagrams, respectively. (B,C) Distribution of translocation junctions at IgH in the pooled ΔSγ12xI-SceI (B) or c-myc25xI-SceI (C) HTGTS libraries. Translocations in WT (top) and AID−/− (bottom) B cells are shown. Positions of S regions within the 250 kb IgH CH region are indicated. Color codes are as in Fig. 2. Dot size, position of centromere (red oval) and telomere (green rectangle), and orientation of the sequencing primer are indicated. See also Fig. S4.

