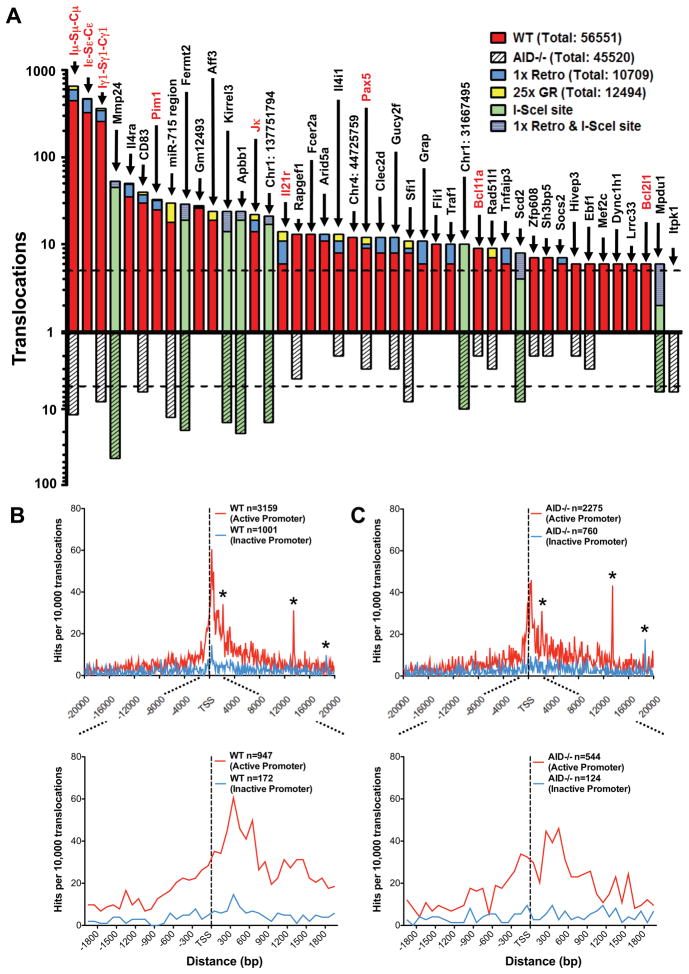
Figure 4. Identification of specific and general translocation hotspots.
(A) Graph representing translocation numbers in frequently hit genes and non-annotated chromosomal regions. Only hotspots with more than 5 hits are shown and are ordered based on frequency of translocations in the pooled c-myc25xI-SceI/WT HTGTS library (top bars). Respective frequencies of translocations in the pooled c-myc25xI-SceI/AID−/− HTGTS library are displayed underneath (bottom bars). Green bars represent frequent hits involving cryptic I-SceI sites. Blue and yellow portions of top bars represent translocations found in c-myc1xI-SceI and c-myc25xI-SceI/ROSAI-SceI-GR libraries, respectively. Genes translocated in human and mouse lymphoma or leukemia are in red. The dashed line represents the cutoff for significance over random occurrence for each of the two groups (see Table S3). (B and C) Genome-wide distribution of translocations relative to TSSs. Junctions from c-myc25xI-SceI/WT (B) or c-myc25xI-SceI/AID−/− (C) libraries (excluding 2 Mb around chr15 breaksite and IgH S regions) are assigned a distance to the nearest TSS and separated into “active” and “inactive” promoters as determined by GRO-seq. Translocation junctions are binned at 100 bp intervals. n represents the number of junctions within 20 kb (upper panels) or 2 kb (lower panels) of TSS. Asterisks indicate cryptic genomic I-SceI sites. See also Fig. S5.

