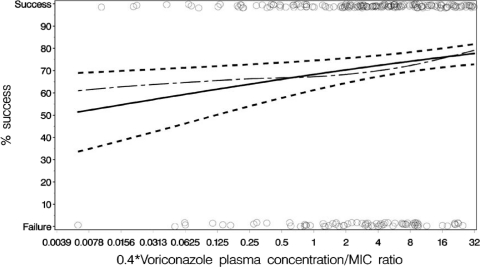
Fig. 2.
Binomial data and linear logistic fit for investigator outcome versus the mean voriconazole free drug/MIC ratio for 404 patients. ○, Data points separated as clinical success or clinical failure. Curves: - — -, spline; ——, line of predicted fit; - - -, upper and lower 95% confidence intervals. The slope was significant at P = 0.005. Note that the free ratio is 0.4 × the ratio. Calculation: logit (P) = (0.766 + 0.139) × loge free ratio, where P is the probability of response.

