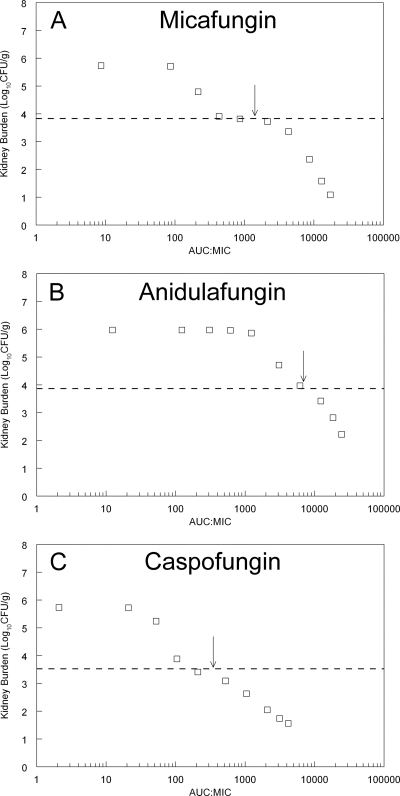
Fig. 6.
Predictions from the mathematical model for each echinocandin. Each point represents the predicted fungal burden at the end of the experiment (i.e., 101 h postinoculation and following four doses of drug administered at 5, 29, 53, and 77 h postinoculation) for a given AUC/MIC ratio. The dotted line is the stasis line, which represents the fungal burden in the kidney at the time therapy is initiated 5 h postinoculation. The arrows represent the AUC/MIC ratio in an average patient receiving micafungin at 100 mg/day, anidulafungin at 100/day, and caspofungin at 50 mg/day. The exposure-response relationships show a shoulder as antifungal activity transitions from a fungistatic to fungicidal pattern.

