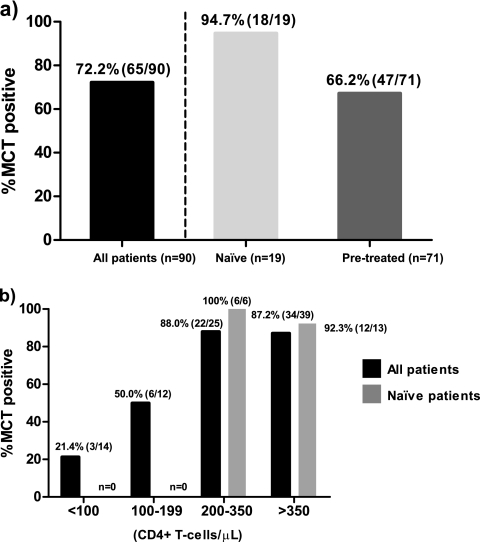
Fig. 1.
Frequency of virological response after MCT. (a) Percentage of subjects with a virological response after a short-term MRV exposure (MCT positive). Black bar, percentage of MCT-positive subjects in the total population. The population was also split into pretreated and treatment-naïve subjects (gray bars). (b) Percentage of MCT-positive subjects depending on different baseline CD4+ T-cell strata. Black bars, total number of subjects; gray bars, treatment-naïve subjects. We did not observe any treatment-naïve subjects in the lower CD4+ T-cell strata (<100 and 100 to 199 cells/μl).

