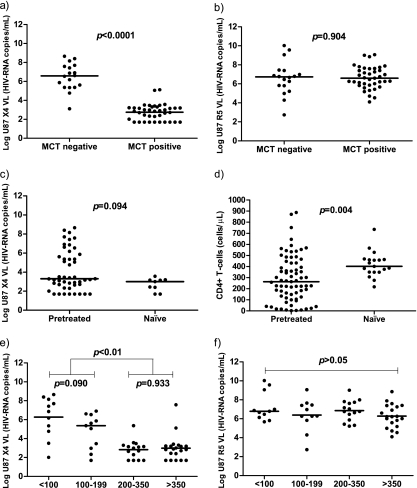
Fig. 2.
X4- and R5-tropic virus levels and CD4+ T-cell levels depending on treatment category. Log viral loads in the U87-X4 and U87-R5 well supernatants were used to express X4- and R5-tropic virus levels. (a) MCT-positive patients (n = 39) presented significantly lower X4-tropic virus levels than MCT-negative patients (n = 18); (b) R5-tropic virus levels were similar in patients with different responses after MCT; (c) treatment-naïve patients (n = 9) presented a trend toward lower X4-tropic virus levels than pretreated patients (n = 48); (d) in addition, treatment-naïve patients (n = 19) showed higher CD4+ T-cell levels than pretreated patients (n = 71); (e) patients with the lower CD4+ T-cell strata (<100 CD4+ T cells/μl [n = 11] and 100 to 199 CD4+ T cells/μl [n = 11]) presented significantly higher X4-tropic virus levels than patients with higher CD4+ T-cell strata (200 to 350 CD4+ T cells/μl [n = 15] and >350 CD4+ T cells/μl [n = 20]); (f) on the contrary, R5-tropic virus levels were independent of the CD4+ T-cell strata. Black bars, median. The Mann-Whitney U test was used.

