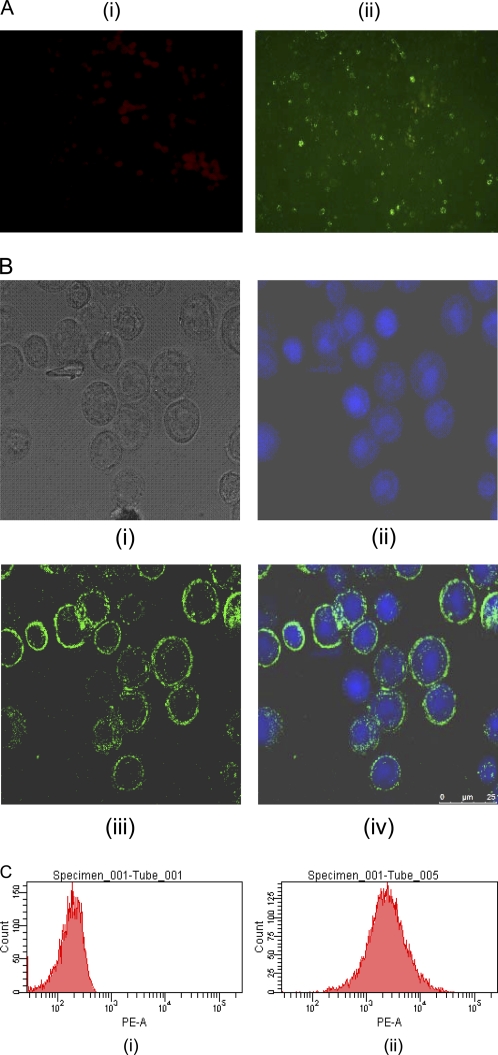
Fig. 2.
(A) Immunofluorescence analysis. The r-RVG-expressing and control Sf-9 cells were allowed to react with the MAb specific to RVG and then stained with FITC-conjugated rabbit anti-mouse IgG. (i) Uninfected control Sf-9 cells; (ii) infected, unfixed Sf-9 cells expressing r-RVG. A typical membrane fluorescence pattern was observed using a fluorescence microscope (magnification, ×200). (B) Confocal microscopy analysis. The r-RVG-expressing Sf-9 cells were stained using the MAb specific to the RVG and then with Alexa Fluor 488-conjugated goat anti-mouse IgG. The fluorescence was observed using a confocal microscope (25 μm). (i) Light microscopy image of infected Sf-9 cells; (ii) DAPI-stained cells; (iii) goat anti-mouse IgG-Alexa Fluor 488-stained cells; (iv) composite of DAPI- and Alexa Fluor 488-stained cells. (C) Flow cytometry analysis. The control and infected Sf-9 cells were labeled with the MAb specific to the RVG and then stained using RPE-conjugated anti-IgG2a. The expression of r-RVG was analyzed by flow cytometry. PE-A, phycoerythrin-area.

