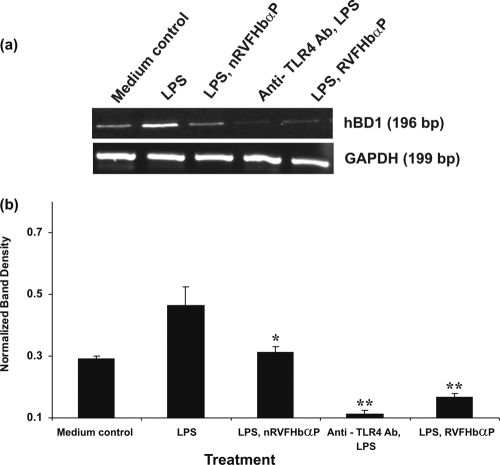
Fig. 7.
RT-PCR analysis of hBD1 gene expression in HeLa hVECs. Cells were seeded at a density of 106/well in 24-well plates and treated with LPS (10 μg/ml for 6 h), or LPS-induced (10 μg/ml for 6 h) cells were treated with RVFHbαP (70.45 μM for 1 h) or scrambled peptides (70.45 μM for 1 h). At the end of treatment, cells were collected and lysates were prepared and analyzed for hBD1 and GAPDH mRNAs by RT-PCR as detailed in Materials and Methods. (a) Expression of hBD1 mRNA was upregulated in LPS-induced cells and attenuated following the treatment of LPS-induced cells with RVFHbαP in respect to the scrambled peptide. Values were calculated as the means ± SD of triplicate determinations and are representative of at least three separate experiments performed on different days. Complete inhibition of hBD1 was observed when cells were treated with anti-TLR4 antibody before LPS induction. A representative image of RT-PCR analysis of hBD1 mRNA expression is shown. GAPDH blots confirmed roughly equivalent loading of RNA samples. (b) A quantitative assessment of the intensity of each band was determined by densitometry. Levels of significance (*, P < 0.05 compared with the LPS; **, P < 0.001 compared with the LPS- and LPS-nRVFHbαP-treated groups) were calculated by an ANOVA test followed by a Bonferroni analysis.

