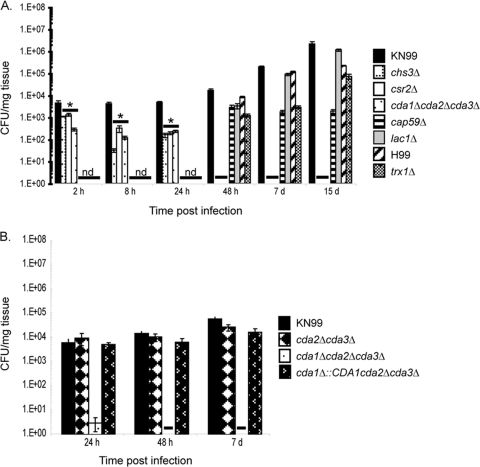
Fig. 4.
Fungal burden over time for selected strains. Data are from four mice per strain. Strains are listed to the right of each graph. nd, not determined; a dash indicates no live cells were recovered. (A) *, significant difference between deletion strains and wild type at 2 h (chs3Δ, P = 0.009; csr2Δ, P = 0.010; cda1Δ cda2Δ cda3Δ, P = 0.003); P < 0.001 for the 8-h and 24-h time points based on one-way analysis of variance with Dunnett's post hoc test. Data represent one of two independent isolates for each chitosan-deficient strain after the 24-h time point. Standard errors are shown. (B) Fungal burden of the complemented strain. Wild-type and cda2Δ cda3Δ controls were included.

