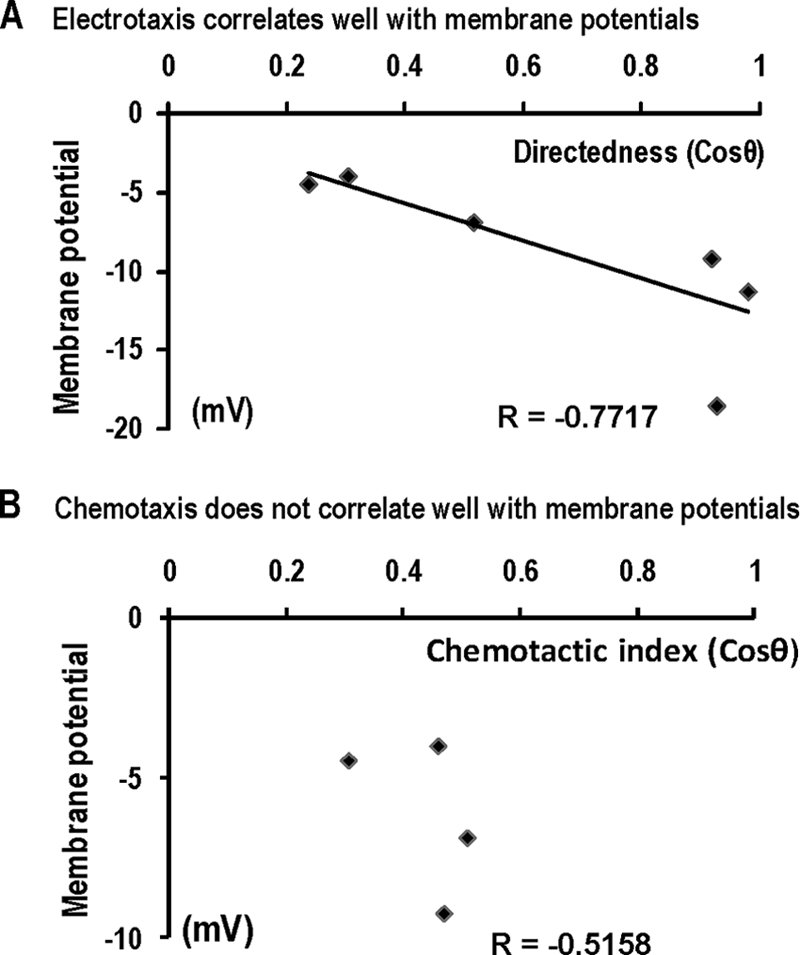
Fig. 5.

Significant correlation is between Vm and electrotaxis but not chemotaxis. (A) Scatter plot shows electrotactic directedness and resting membrane potential (r = −0.77). The best-fit line is shown. (B) Scatter plot shows chemotactic index and membrane potential (r = −0.51).
