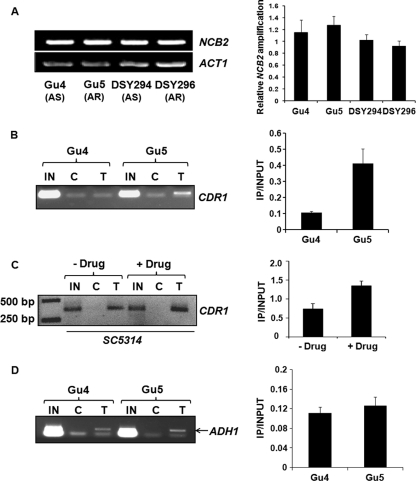
Fig. 4.
Enrichment of Ncb2 at activated CDR1 promoters. (A) RT-PCR analysis of NCB2 transcript levels in two genetically matched AS and AR C. albicans clinical isolates. On the left is the NCB2 amplification of reverse-transcribed DNA prepared from the indicated isolates. A bar diagram showing integrated density values (IDV) of NCB2 amplification normalized with respect to constitutive gene (ACT1) amplification in C. albicans clinical isolates is shown in the right panel. Error bars represent standard deviations of results from three different RNA preparations. (B) ChIP analysis of Ncb2 association with the CDR1 promoter in AS and AR isolates. Chromatin immunoprecipitation was performed on chromatin isolated from AS and AR isolates Gu4 and Gu5, respectively. IN is input DNA (10%), and C and T stand for immunoprecipitations carried out on cross-linked chromatin with preimmune serum and anti-Ncb2 antibody, respectively. ChIP was performed in triplicate, and a representative figure is shown. The bar diagram on the right shows an approximately 4-fold enrichment of Ncb2 at the CDR1 promoter in the Gu5 isolate. The enrichment value is represented as a ratio of immunoprecipitation (IP) versus input. Error bars represent standard deviations of values generated from three different experiments. (C) Increased association of Ncb2 with the CDR1 promoter in cells transiently induced for CDR1 expression by fluphenazine compared to that of uninduced cells. The figure is a reverse of the original photo for a better representation. The panel to the right is a bar diagram showing approximately 1.8-fold enrichment of Ncb2 at the fluphenazine-induced CDR1 promoter. Error bars denote standard deviations from three replicate experiments. (D) ChIP analysis of Ncb2 association with the ADH1 promoter in Gu4 and Gu5 isolates. The specific band above the primer dimer is shown by an arrow in the figure.

