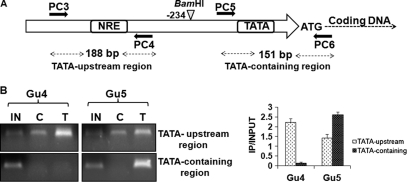
Fig. 5.
Ncb2 positional occupancy on the CDR1 promoter is different during repression and activation. (A) Schematic representation of the position of primer sets used in a modified chromatin restriction digestion-coupled immunoprecipitation (CRIP) assay. (B) CRIP assay showing the enrichment of Ncb2 at the core promoter region containing the TATA box element in AR isolate Gu5. The enrichment of Ncb2 at the TATA upstream promoter (NRE-containing) fragments is seen in AS isolate Gu4. IN, C, and T represent input DNA (5%) and immunoprecipitates obtained with control preimmune serum and specific anti-Ncb2 antibody, respectively. A bar diagram showing the difference in enrichment of Ncb2 at TATA upstream and TATA-containing fragments of the CDR1 promoter between AS and AR isolates is shown on the right.

