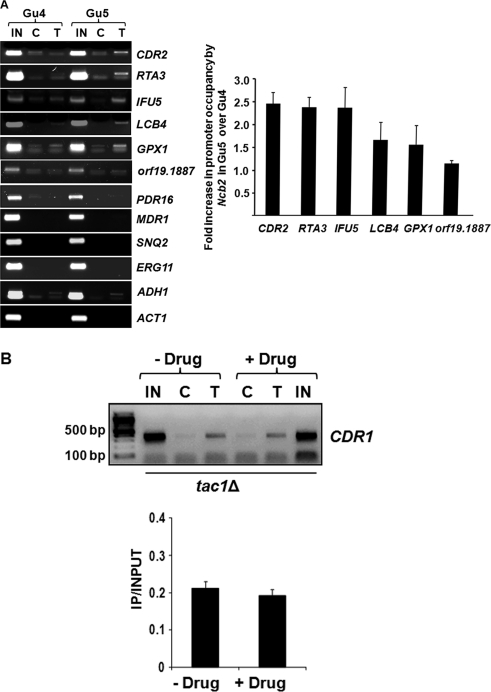
Fig. 6.
Ncb2 plays a role in the regulation of Tac1-activated genes. (A) ChIP analysis of Ncb2 association with the promoters of a selected set of genes of C. albicans in AS and AR isolates. The fold enrichment in Ncb2 recruitment at the promoters of genes regulated by Tac1 in Gu5 above the level of enrichment for Gu4 is represented as a bar diagram on the right. Error bars denote standard deviations for three replicate experiments. (B) ChIP analysis of Ncb2 association with the CDR1 promoter in tac1Δ cells with or without fluphenazine treatment. IN, C, and T are the same as those described in the legend to Fig. 4. The figure is a reverse of the original photo for a better representation. A bar diagram of the figure is shown in the lower panel. Error bars denote standard deviations from three replicate experiments.

