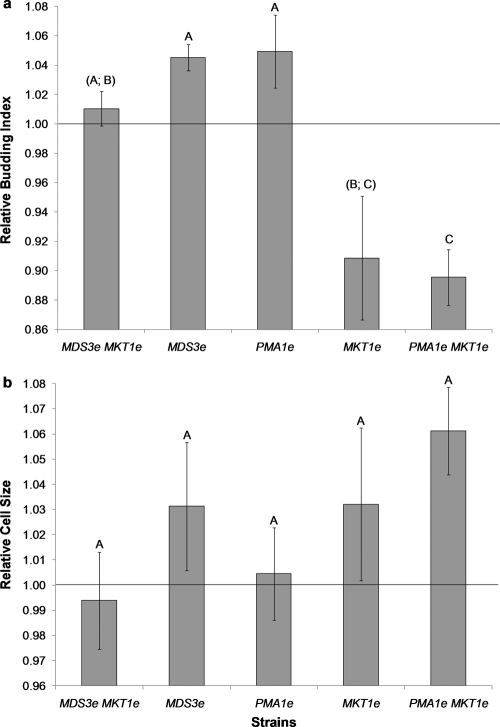
Fig. 5.
Relative budding index and cell size measurements for yeast strains carrying evolved alleles. Bars represent the mean budding index values (a) and cell sizes (b) of strains carrying evolved alleles relative to the values obtained for the progenitor strain. Values for strains with the same capital letters above the bars are not significantly different from each other (by the Tukey HSD test with 95% simultaneous confidence intervals). Error bars, ±1 standard error of the mean (n = 3).

