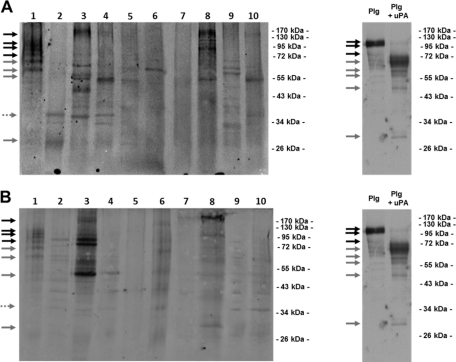
Fig. 1.
(A) Immunoblot analysis of crude fecal extracts from subjects 1 to 10 carried out by using polyclonal anti-Plg IgG antibodies. As positive controls, 5 μg (each) of Plg and Plg activated to plasmin by a preincubation with 0.06 kallikrein inhibitor units (KIU) uPA was loaded. Black arrows indicate protein bands attributable to plasminogen isoforms (∼90 to 100 kDa). Gray arrows indicate plasmin heavy chain A (∼65-kDa), plasmin heavy chain A short form (∼57-kDa), and plasmin light chain B (∼25-kDa) isoforms. Dotted arrow indicates angiostatin (∼38 kDa), which corresponds to the first four kringle domains of Plg isoforms. (B) Immunoblot analysis with polyclonal anti-Plg IgG antibodies of cell wall proteins purified from B. animalis subsp. lactis BI07 cells incubated with fecal extracts from subjects 1 to 10. Arrows indicate Plg and plasmin isoforms as reported above.

