
Figure 1.
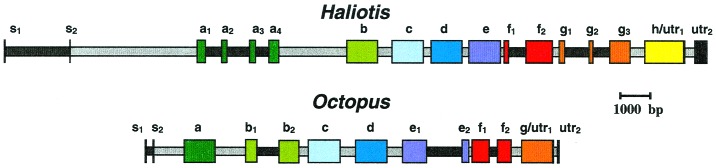
Gene structures of HtH1 and OdHG. Exons encoding FUs (a–h) are shown in different colors; introns (gray for linker introns, black for internal introns) are shown to scale. s1 and s2 correspond to the two exons encoding each signal sequence. utr indicates the 3′ UTR.