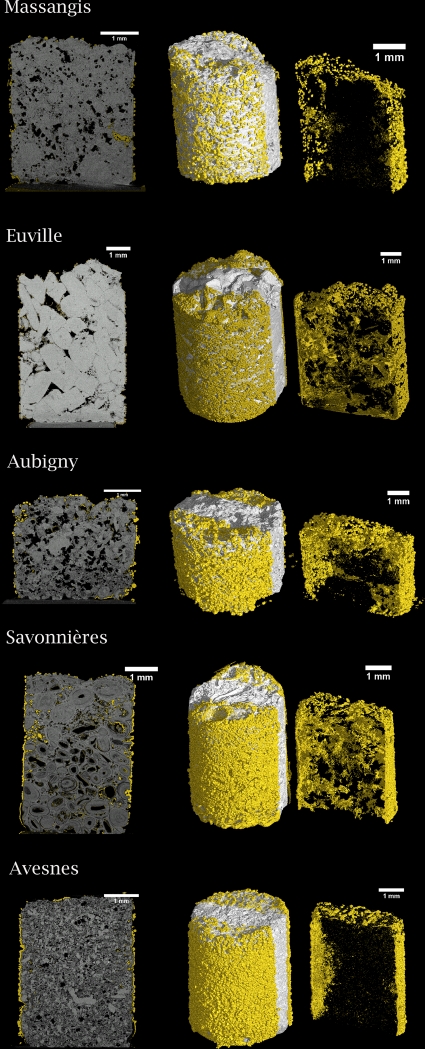
Fig. 5.
2D (left) and 3D (middle and right) microtomographs of biodeposition-treated limestone. Limestone cylinders were treated on all sides by immersion. Newly formed carbonate crystals are yellow. A rectangular region (right picture) was extracted from the limestone core (middle picture) in order to get an appreciation of the distribution of the biogenic crystals inside the pores of the limestone. Note the differences in coverage and penetration depth in the different types of biodeposition-treated stone.

