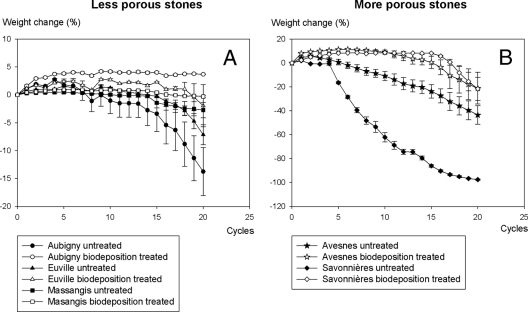
Fig. 8.
Influence of the biodeposition treatment on the resistance of stone to salt attack. A smaller weight loss after freezing and thawing indicates higher resistance to salt attack. Note the difference in scale between the y axes of the two graphs. Weight loss is expressed as a percentage of the initial dry weight of the stone.

