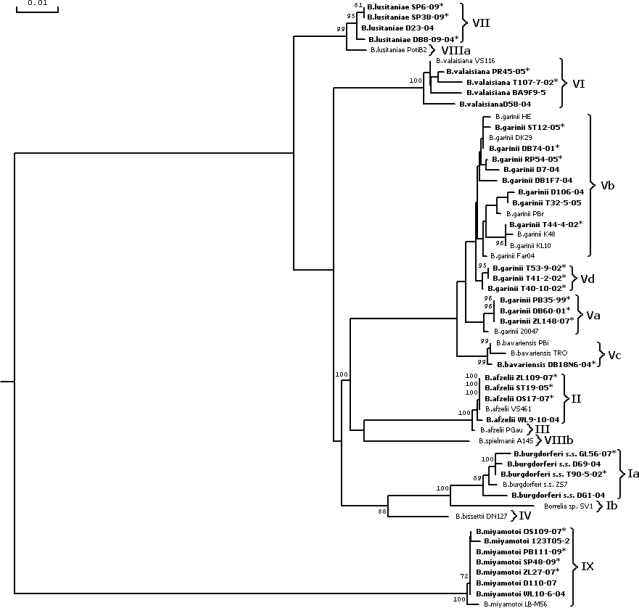
Fig. 3.
Dendrogram of genetic relationships among the flaB DNA sequences of the European Borrelia strains based on PCR-RFLP analysis. The tree was constructed by a maximum-likelihood method. The values in the tree represent bootstrap results. Polish strains are in boldface. *, sequences used in this study; Ia to IX, restriction patterns.

