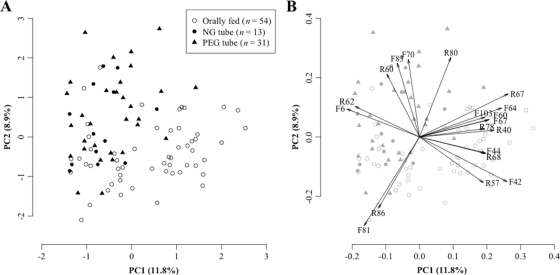
Fig. 1.
(A) Principal-component analysis (PCA) diagram showing the similarity relationships among the 98 T-RFLP profiles. The T-RFLP profile of each subject is plotted according to feeding mode: orally (○), by percutaneous endoscopy gastrostomy (PEG) tube (▴), and by nasogastric (NG) tube (•). These two components explain 20.7% of the variance. (B) Loading plot of the first two principal components. Only 19 TRFs with large factor loading (>0.5 in absolute value) on the first or second principal component were selected, and these are indicated by arrows.

