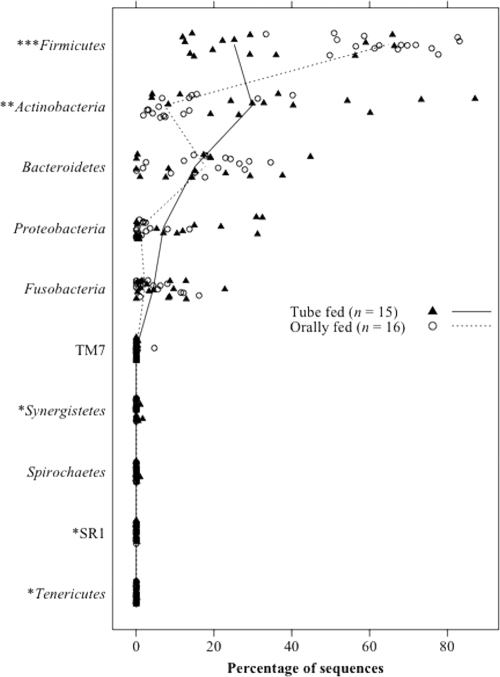
Fig. 3.
Relative abundance of each phylum in the tongue microbiota of 31 subjects. The median percentages in the tube-fed and orally fed subjects are represented by solid and broken lines, respectively. P values were calculated using Wilcoxon's signed-rank test. *, P < 0.05; **, P < 0.01, ***, P < 0.001.

