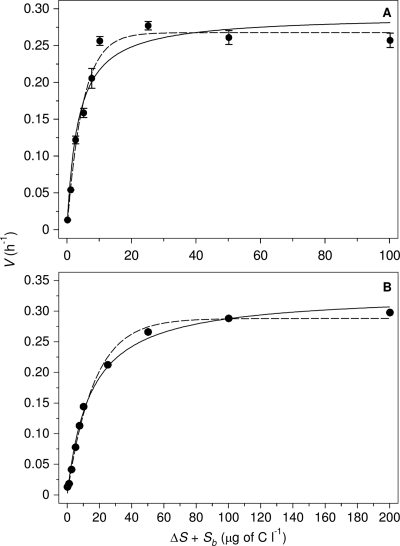
Fig. 1.
Growth rate V (h−1) of F. johnsoniae strain A3 at 15°C in relation to the concentration ΔS of laminarin (A) and maltose (B) added to pasteurized tap water with an apparent indigenous substrate concentration Sb of 0.2 (± 0.00) μg biopolymer C equivalents liter−1. Data modeled according to Monod kinetics (solid line) and Teissier kinetics (dashed line). Error bars represent standard deviation of V in duplicate flasks. In panel B, error bars are not visible because the standard deviation was ≤0.005 h−1 for all V values determined.

