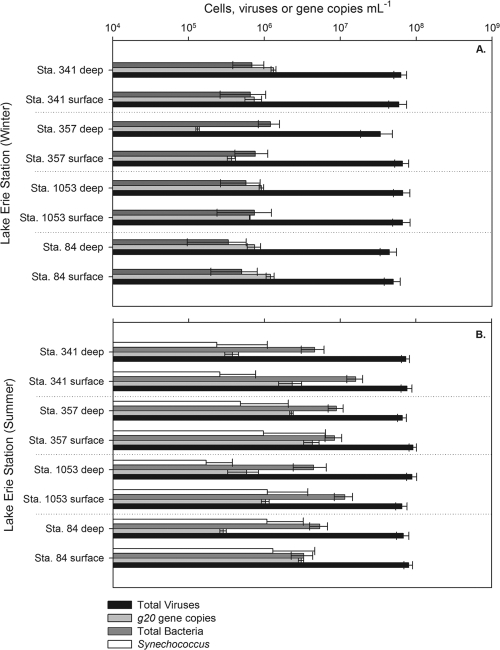
Fig. 2.
Abundances of total viruses (black), total bacteria (dark gray), Synechococcus (white), and g20 genes (light gray) for each station and month sampled. (A) Abundances in the winter samples. (B) Abundances in the summer samples. Error bars for virus and bacterial abundances were calculated from standard deviations from 20 grid views while g20 gene abundance error bars were calculated from triplicate qPCRs.

