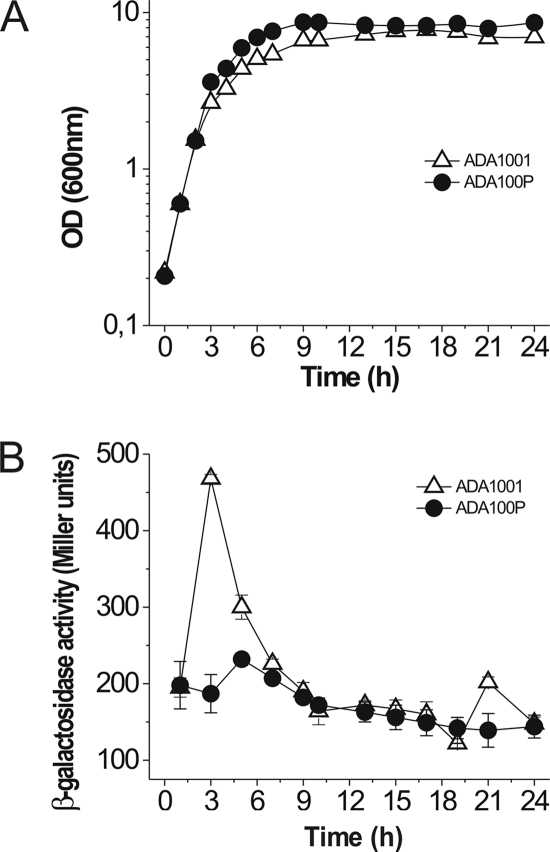
Fig. 2.
Growth and ibpA expression in the presence and absence of PhaP. Growth (A) and ibpA expression (B) were measured for strains ADA1001 (control strain) and ADA100P (PhaP producer) in cultures grown at 37°C. The expression of ibpA was calculated by measuring the β-galactosidase activity of the ibpA-lacZ fusion present in strains ADA1001 and ADA100P. The results shown represent the mean values for each parameter ± standard deviations of duplicate measurements from three independent cultures.

