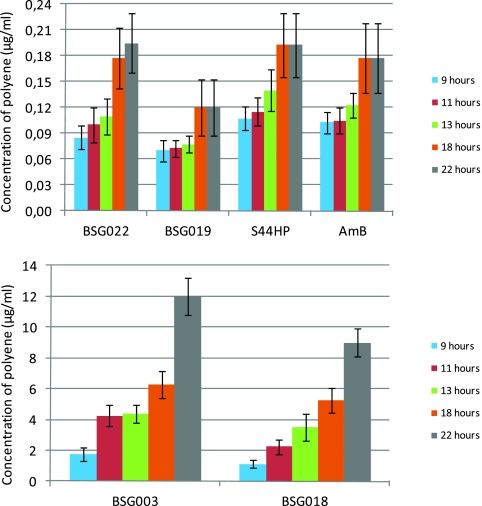
Fig. 2.
Schematic representation of MIC values of nystatin analogues obtained after different time periods of C. albicans exposure to the antibiotics. C. albicans cells were incubated in the presence of different antibiotic concentrations, and cell growth was monitored after 9 h and until 22 h, and the respective MIC values are given. The data for the NysL mutant analogues (BSG022 and BSG019) and AmB and S44HP (top) and the DH15 mutant analogues (BSG003 and BSG018) (bottom) are presented. Different scales on the y axes are due to considerable differences in the MIC values between these two classes of molecules at all time points.

