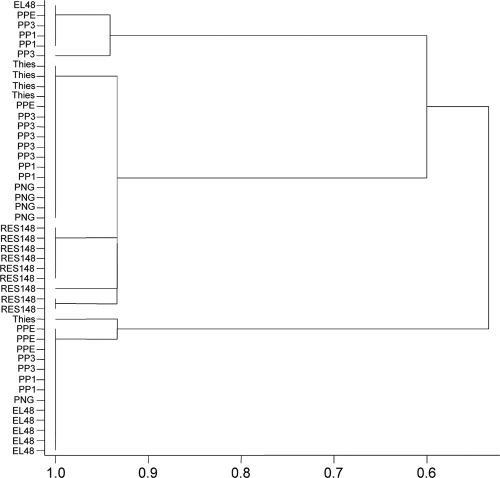
Fig. 1.
Dendrogram from hierarchical cluster analysis of 16S rRNA gene SNP data for all individuals from the seven P. penetrans populations. The x axis shows the similarity measure. The single-link (nearest-neighbor) clustering method was applied to the similarity matrix (formed using simple matching) among the 45 clones.

