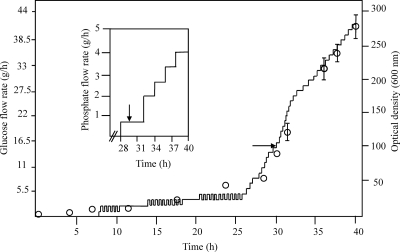
Fig. 1.
Growth curve for BL21(DE3)/pTHBHug and flow rates of glucose and phosphate during bioreactor runs. Solid lines on the large and small graphs indicate flow rates of glucose and phosphate, respectively, during a typical run. Circles indicate optical densities of the culture at 600 nm. The optical density results shown are an average of results from three experiments, and standard deviations below an OD of 6 are not shown. The arrows indicate the time of induction of the cultures with IPTG and the starting point of the heme/base feed.

