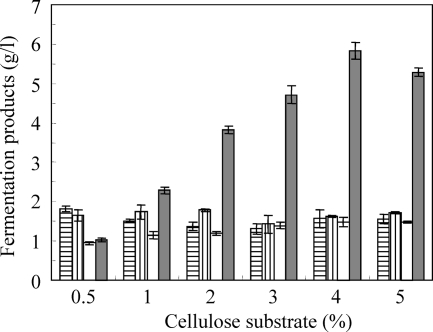
Fig. 4.
Maximal amounts of butanol produced by increasing cellulose substrate concentrations. Bars indicate amounts of acetate (vertical lines), butyrate (horizontal lines), ethanol (white), and butanol (gray). Values are shown as mean of samples assayed in triplicate; error bars indicate standard error.

