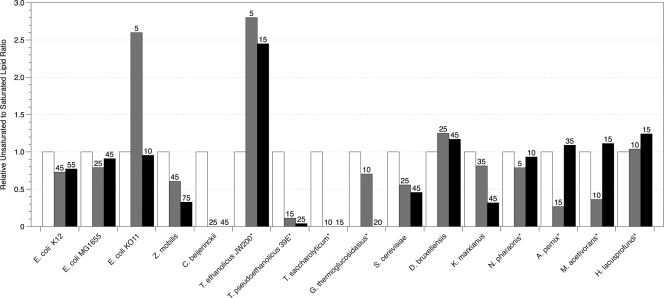
Fig. 2.
Relative unsaturated to saturated lipid ratios of organisms grown in the presence of ethanol determined by GC-MS. The asterisk indicates that branched lipids were used in place of unsaturated lipids because unsaturated lipids were not detected in the samples. Numbers above bars correspond to the concentrations of alcohol in g liter−1 that reduced specific growth rates (μ) by 50% (▩) and 85% (■). The fold change of unsaturated to saturated lipids was calculated based on the unsaturated to saturated lipid ratio of the unexposed cells for each organism. The error of the biological triplicates for each condition was <10%.

