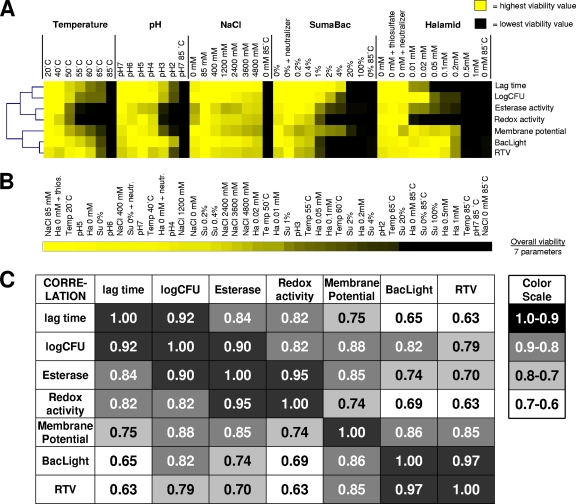
Fig. 6.
Summary of stress impact on viability of L. monocytogenes F2365 and correlation analysis of measured parameters. (A) Graphical illustration of responsiveness of different viability parameters to distinct stresses. Each viability parameter was range scaled, with yellow indicating the highest viability value and black indicating the lowest viability value. (B) Impact scale of different stress conditions on overall viability (calculated as the average of seven range-scaled viability values). Yellow indicates the highest viability value, and black indicates the lowest viability value. (C) Statistical analysis of correlations between measured parameters and conditions. Correlations are expressed as values between 0 (no correlation) and 1.0 (identical; highest correlation). Su, Suma Bac; Ha, Halamid.

