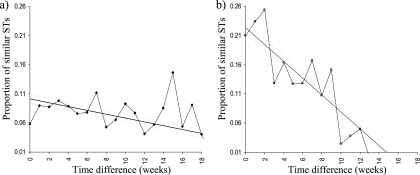
Fig. 7.
Pairwise clustering randomization test to show temporal genetic variation in Campylobacter sequence types isolated from cattle (a) and sheep (b). The straight line shows the linear average and overall trend. The 2 flanking gray lines are the 2.5% and 97.5% confidence levels of the linear average. A diagonal line from left to right shows that the STs become more dissimilar with increasing time difference between collection times; the steeper the gradient, the more dissimilar. A horizontal line for the linear average would show no dissimilarities over time.

