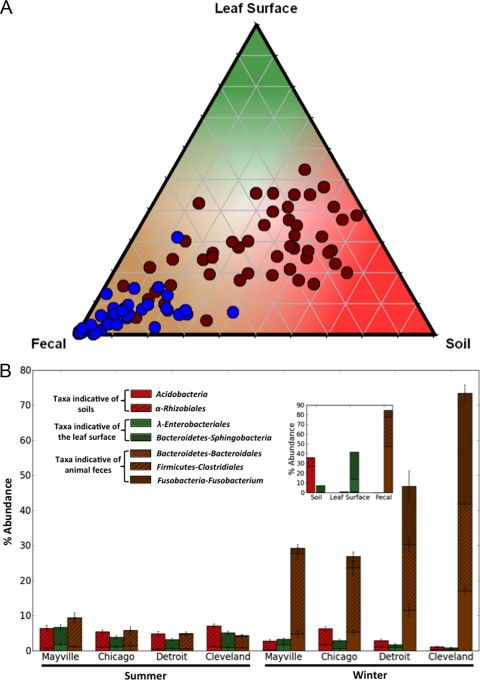
Fig. 5.
Relative contributions of bacteria from likely source environments, i.e., soil, leaf surfaces, and animal feces. (A) Ternary plot representing the relative abundances of the indicator taxa in midwestern air samples color coded by season (maroon, summer; blue, winter), where the shading designates a given source environment (red, soil; green, leaf surface; brown, potential fecal origin). (B) Relative abundances of taxa indicative of the three source environments. (Inset) Relative abundances of these same indicator taxa in their native habitats, i.e., soil, leaf surfaces, and animal feces.

