Figure 1.
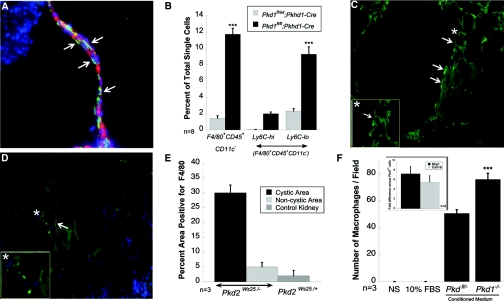
Macrophages surround cysts in murine models of PKD. Kidneys were perfusion fixed with 4% PFA and cryosections stained for macrophage marker F4/80. (A) Cyst-lining cells showing closely apposed macrophages stained green. Green, F4/80; Red, DBA. (B) Quantitative analysis of FACS-sorted macrophages defined as F4/80+CD45+CD11c- cells and further analyzed for Ly6c expression; ***P < 0.0001. (C) Cystic area from Pkd2WS25/- kidney showing several F4/80+ cells (green). Inset shows magnified view of area marked with an asterisk. (D) Noncystic area from Pkd2ws25/+ kidney showing very few F4/80+ cells. Inset shows magnified view of selected area indicated by the asterisk. (E) Quantitative analysis of macrophages in kidneys from Pkd2WS25/- and Pkd2ws25/+ (control) mice. (F) Transwell migration of macrophages toward DMEM-F12, DMEM-F12 + 10%FBS, DMEM-F12 conditioned medium from Pkd1fl/- cells, and DMEM-F12 conditioned media from Pkd1-/- cells, respectively, n = 3. Inset: qRT-PCR for Mcp-1 and Cxcl16 was performed on RNA from Pkd1fl/- and Pkd1-/- cells and reported as the fold increase of Pkd1-/- as compared with Pkd1fl/-; n = 3.

