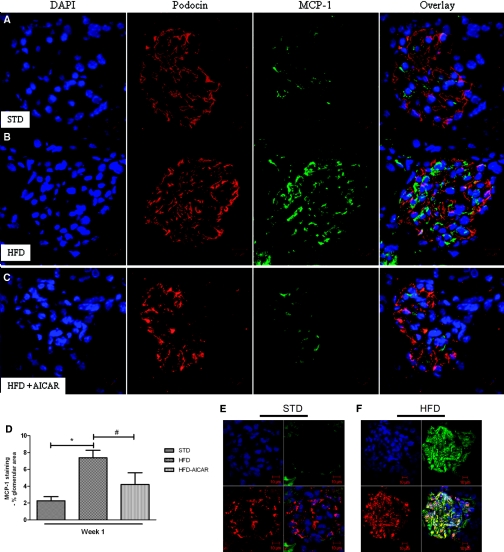
Figure 6.
Increased glomerular MCP-1 with HFD is reduced with AMPK activation. Representative photomicrographs of glomeruli from mice on a (A) STD, (B) HFD, or (C) HFD + AICAR, and (D) semiquantitative analysis of MCP-1-positive staining per glomerular area at week 1. Colocalization of glomerular MCP-1 in mesangial cells. Representative photomicrographs of glomeruli from mice on a (E) STD or (F) HFD at week 12. Megsin (red)/MCP-1 (green); nuclei (blue). Values are means ± SEM. n = 6 in each group. Statistical analyses were performed by one-way ANOVA followed by Newman–Keuls test. *P ≤ 0.05 versus mice on STD; #P ≤ 0.05 versus mice on HFD.

