Figure 1.
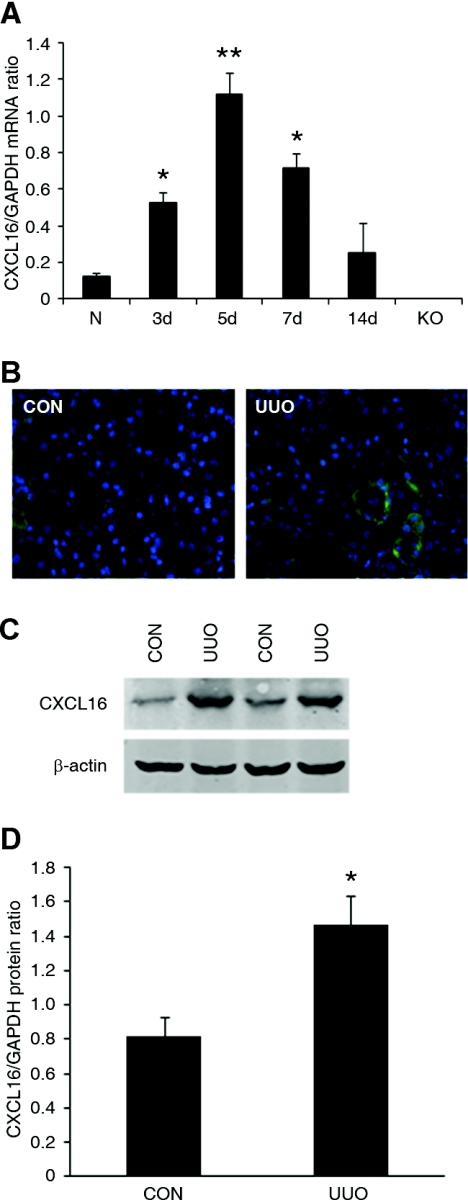
The expression of CXCL16 is induced in the kidney after obstructive injury. (A) Graphic presentation shows the time course of CXCL16 mRNA induction. N indicates normal kidney and KO indicates kidney of CXCL16-KO mice. *P < 0.05 and **P < 0.01 versus normal control kidney. n = 3 to 4. (B) Representative photomicrographs of kidney sections stained for CXCL16 (green) and DAPI (blue) (original magnification, ×400). (C) Representative Western blots show the protein levels of CXCL16 in control kidney and UUO kidney of WT mice. (D) Quantitative analysis of CXCL16 protein expression in the control kidney and UUO kidney of WT mice. *P < 0.05 versus WT controls. n = 4.

