Figure 7.
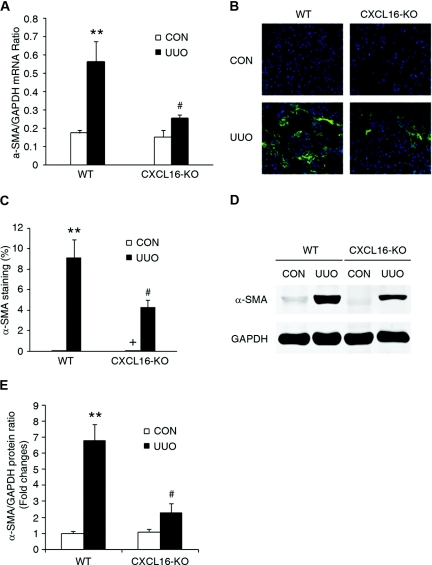
Targeted disruption of CXCL16 reduces α-SMA expression in obstructive nephropathy. (A) The mRNA levels of α-SMA in the kidney of WT and CXCL16-KO mice in response to injury as determined by real-time RT-PCR. **P < 0.01 versus WT controls and #P < 0.05 versus WT UUO. n = 3 to 4 per group. (B) Representative photomicrographs of α-SMA immunostaining in the kidney of WT and CXCL16-KO mice at day 7 after surgery. (C) Quantitative measurements of α-SMA protein expression in the kidney of WT and CXCL16-KO mice. **P < 0.01 versus WT controls and #P < 0.05 versus WT UUO. n = 5 to 6 per group. (D) Representative Western blots show the levels of α-SMA protein expression in the kidney of WT and CXCL16-KO mice. (E) Quantitative analysis of α-SMA protein expression in the kidney of WT and CXCL16-KO mice. **P < 0.01 versus WT controls and #P < 0.05 versus WT UUO. n = 3 per group.

