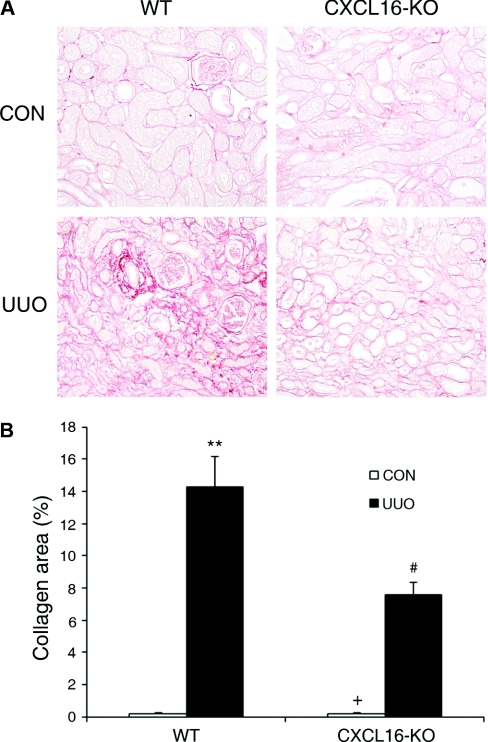
Figure 8.
Targeted disruption of CXCL16 attenuates renal fibrosis and ECM deposition. (A) Representative photomicrographs show kidney sections stained with picrosirius red for assessment of total collagen deposition (original magnification, ×200). (B) Quantitative analysis of renal interstitial collagen in different groups as indicated. **P < 0.01 versus WT controls, +P < 0.05 versus KO UUO, and #P < 0.05 versus WT UUO. n = 5 to 6 per group.

