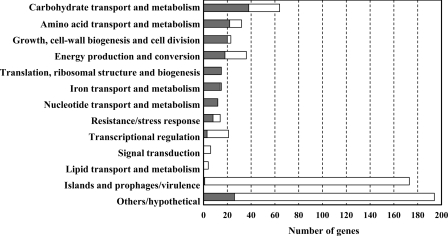
Fig. 1.
H2-affected differential expression of genes belonging to functional groups in S. enterica serovar Typhimurium. Bars represent percentage of differentially expressed genes belonging to each group. White bars indicate the proportion of downregulated genes, and gray bars indicate the proportion of upregulated genes.

