Fig. 7.
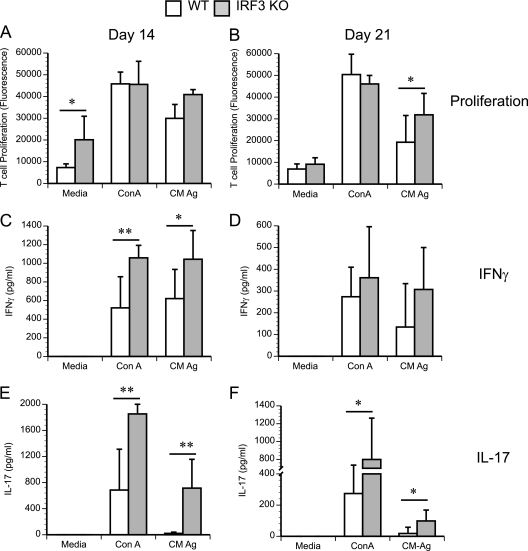
IRF3 KO T cells display increased intrinsic and chlamydial-antigen-specific T cell responses during infection. WT control and IRF3 KO mice were infected with 1 × 10⁶ IFU/ml of C. muridarum. Iliac lymph node cells were isolated from WT and IRF3 KO mice at days 7, 14, and 21 postinfection (four mice per group). Cells were stimulated in vitro with either medium, the T cell mitogen ConA, or C. muridarum antigen (CM Ag). Proliferation was quantitated using alamarBlue, and data for all panels represent the mean fluorescence ± the standard deviation calculated from values obtained by assaying T cell proliferation from cells derived from individual mice. Data from day 14 (A) and day 21 (B) postinfection are shown. T cell proliferation supernatants were diluted 1:10 for IFN-γ analysis (C and D) and assayed directly for IL-17 (E and F). *, P < 0.05; **, P < 0.01, as measured by a t test.

