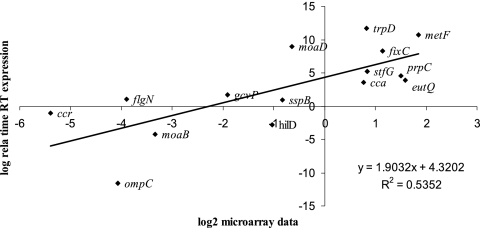
Fig. 2.
Correlation between microarray and real-time RT-PCR expression values. Log2-transformed expression values for 15 genes from total bacterial RNA extracted from day-old-chick cecal contents in triplicate. The best-fit linear regression line is shown together with the r2 value and the calculated slope equation.

