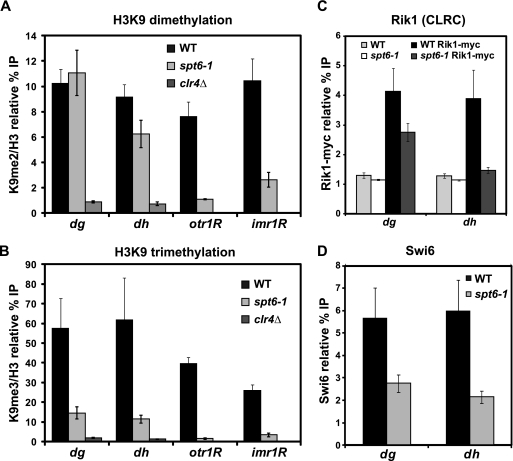
Fig. 4.
Analysis of histone H3 lysine 9 dimethylation and trimethylation levels at pericentric repeats and silencing reporters. (A, B) ChIP analysis was used to measure H3K9 dimethylation and trimethylation levels over the pericentric dg and dh repeats, as well as the ura4+ reporter gene inserted at otr1R and imr1R, in both wild-type (WT) and spt6-1 strains. ChIP was conducted with antibodies specific to H3K9me2, H3K9me3, or total H3. In all cases, binding was assessed by qPCR. Columns represent the mean normalized value ± standard error (SE) (n = 3 to 13). Unnormalized data and no-antiserum controls are shown in Fig. S1, available at http://genepath.med.harvard.edu/∼winston/supplemental.htm. (C) ChIP analysis of the Rik1 subunit of the CLRC H3K9 methyltransferase complex. Rik1 was tagged with 13-myc at the endogenous locus, and binding was measured by immunoprecipitation with an anti-myc antiserum. Columns represent the mean normalized value ± SE (n = 6). Untagged controls indicate background levels of Rik1 binding. (D) ChIP analysis of the recruitment of Swi6, using a Swi6-specific antiserum (72). Columns represent the mean normalized value ± SE (n = 6), and no-antiserum controls are shown in Fig. S2, available at http://genepath.med.harvard.edu/∼winston/supplemental.htm.

