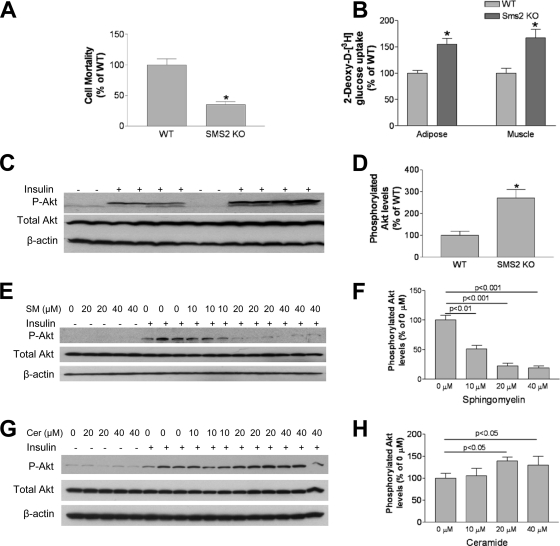
Fig. 10.
Effects of Sms2 deficiency on insulin signaling. (A) Lysenin-mediated cell lysis assay. (B) Liver Akt phosphorylation measurement. (C) Quantitative display of Akt phosphorylation. (D) Effects of exogenous SM on Akt phosphorylation. HepG2 cells were incubated with exogenous SM at 0, 10, 20, or 40 μM for 5 h; the cells were then treated with 100 nM insulin for 10 min, and Akt phosphorylation in whole-cell homogenates was measured. (E) Quantitative display of phosphorylated Akt. (F) Effects of exogenous ceramide (C16:0) on Akt phosphorylation. HepG2 cells were incubated with 0, 10, 20, or 40 μM exogenous ceramide for 5 h; the cells were then treated with 100 nM insulin for 10 min, and Akt phosphorylation in whole-cell homogenates was measured. (G) Quantitative display of phosphorylated Akt. Values are means ± SD (n = 5). *, P < 0.01.

