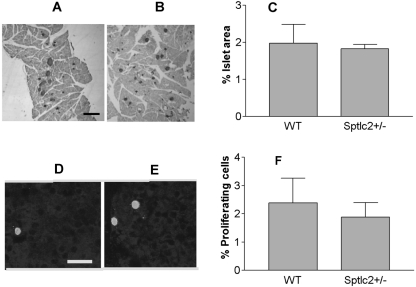
Fig. 4.
Heterozygous Sptlc2 deficiency has no effect on beta cell mass and proliferation. (A and B) Photomicrographs illustrating sections of the pancreas of WT (A) and Sptlc2 KO (B) mice immunostained for visualization of insulin, using diaminobenzidine as a substrate. Islets were visualized by the brown reaction product on beta cells. Similarly processed sections were used for morphometric analysis of beta cell mass. Bar, 150 μm. (C) Histogram analyzing the presence of similar beta cell mass in Sptlc2 KO and littermate controls. Beta cell mass was determined as described in Materials and Methods (n = 3, with at least 10 fields per mouse/strain evaluated). (D and E) Photomicrographs illustrating beta cells in a section of WT (D) and Sptlc2 KO (E) that were processed for visualization of insulin and the proliferation marker Ki67. Note that the cell indicated with green is IN+ Ki67+. Bar, 20 μm. (F) Histogram documenting the percentage of proliferating (IN+ Ki67+) cells per total number of IN+ cells scored. At least 6,000 IN+ cells were scored per mouse, and 3 mice per strain were analyzed.

