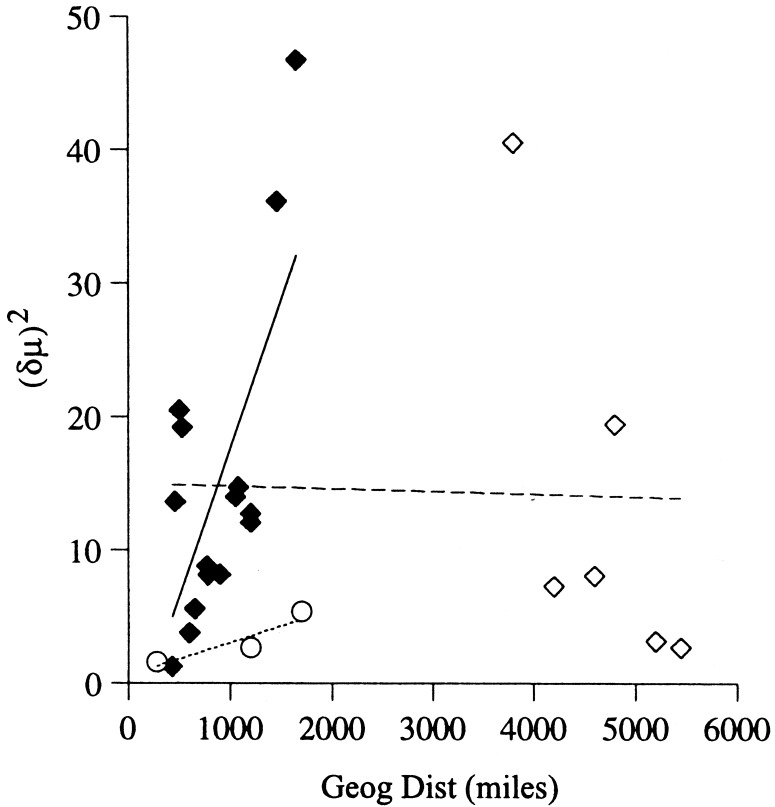
Figure 3.
Scatterplots of genetic and geographical distances separating each pairwise combination of populations. CA populations are signified by circles; North American non-CA populations by filled diamonds; and South American non-CA populations by open diamonds. The regression line is dotted for CA (P = 0.16, not significant), solid for non-CA excluding the South American isolates (P = 0.017, significant), and dashed for non-CA including the South American isolates (P = 0.362, not significant).

