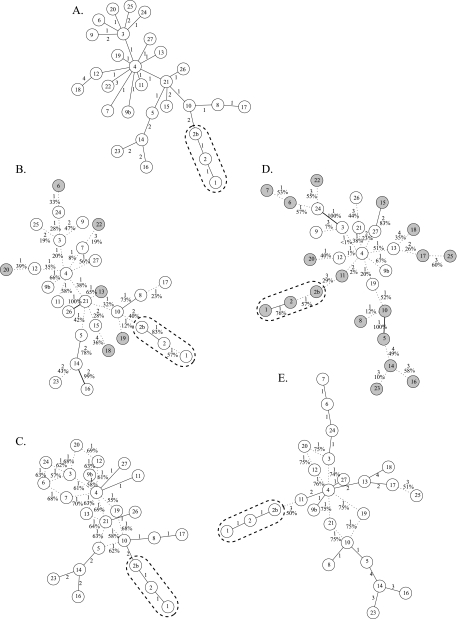
Fig. 2.
Reanalysis of a published MST. MSTs and MSNs of M. bovis strains collected by Lari et al. (13). Node designations are arbitrary. BCG-like strains (nodes 1, 2, and 2b) are enclosed by dashed lines. Individuals that are placed differently in the published tree and in the highest-credibility trees are shaded in gray on the highest-credibility trees. (A) MST published by Lari et al. (13), where different VNTR states are treated as equidistant. (B) MST with the highest bootstrap value based on an equidistant pairwise distance matrix. The lengths of the edges and their bootstrap percentages are indicated. Edges with less than 70% bootstrap support are indicated by dashed lines. (C) Fifty-percent-majority MSN based on an equidistant pairwise distance matrix. The length of each edge is indicated. The percentage of MSTs containing the edge is reported if that value is less than 100%. Edges appearing in all MSTs sampled are solid lines, and all others are dashed. (D) MST with the highest bootstrap value based on an arithmetic pairwise distance matrix. The edges are labeled as in panel B. (E) Fifty-percent-majority MSN based on an arithmetic pairwise distance matrix. The edges are labeled as in panel C.

