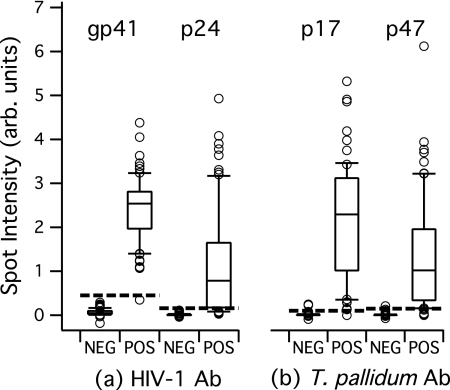
Fig. 3.
Antibody reactivity in the MBio system for clinical samples with known HIV-1 and T. pallidum serostatus. Spot intensity is the background-subtracted, normalized intensity described in the text. Antibody reactivity against all antigens in Fig. 3 and 4 is measured simultaneously for each sample. The horizontal solid bar in each box represents the median; upper and lower boundaries of the boxes are the 75th and 25th percentiles; and the upper and lower whisker bars are the 90th and 10th percentiles, respectively. The open circles represent samples with values above and below the 90th and 10th percentiles. The dashed lines are empirically derived cutoffs. (a) Antibody reactivity results for a total of 224 samples with known HIV-1 Ab reactivity status (82 positive and 142 negative). (b) Antibody reactivity results for a total of 170 samples with known treponemal Ab reactivity status (68 positive and 102 negative). arb. units, arbitrary units; NEG, negative; POS, positive.

