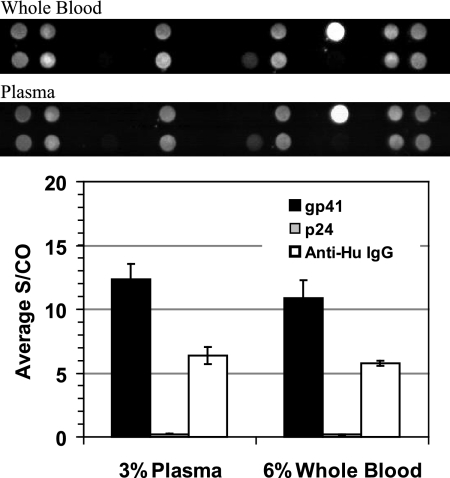
Fig. 5.
Comparison of whole blood and plasma results performed with the MBio system. Cartridges were processed with 6% whole blood or 3% plasma from the same venipuncture sample approximately 24 h after draw. The larger volume of whole blood was to approximately compensate for cell volume. The array layout was as in Fig. 2. Images for the whole blood and plasma from this HIV-positive sample were essentially identical, demonstrating that there is no cellular or hemoglobin-induced interference in the system. The bar graph provides quantitative output for the gp41, p24, and anti-human IgG spots on the arrays. Note that the anti-human IgG is printed at a very low concentration in the array, with activity tuned to give signal on the same scale as that of positive antigen spots. Total IgG is in large excess in the sample. Data presented are mean values for three replicate cartridges for each sample type. Error bars represent one standard deviation. See the text for a detailed discussion.

