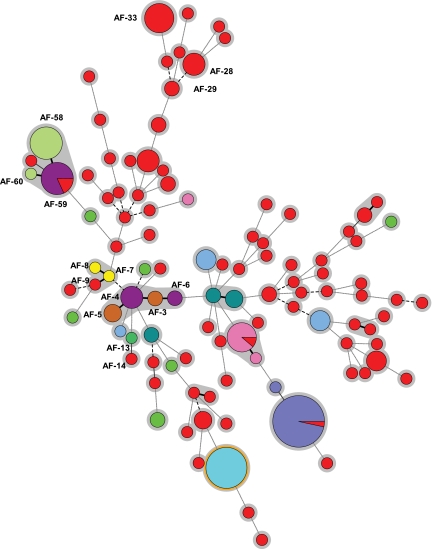
Fig. 1.
Minimum spanning tree showing wide genotypic diversity in the strains studied. The figure shows the 105 different genotypes found (circles), the number of strains belonging to the same genotype (sizes of the circles), and the source of the isolates (circles in red indicate environmental isolates; other colors represent individual patients [n = 10]). Connecting lines between circles show the similarity between profiles: solid and bold indicate differences in only 1 marker, a solid line indicates differences in 2 markers, long dashes indicate differences in 3 markers, and short dashes indicate differences in 4 or more markers. The genotypes mentioned in the text are indicated (AF-xx). Clonally related genotypes (microvariants) are connected by a solid, bold line.

