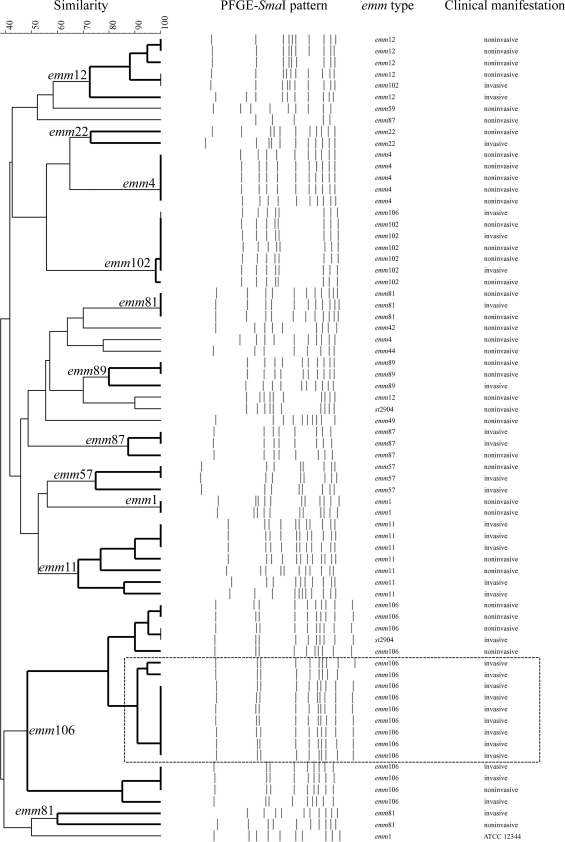
Fig. 3.
Dendrogram showing pulsed-field gel electrophoresis (PFGE) of group A Streptococcus isolates digested by the SmaI restriction enzyme and the corresponding emm types and clinical manifestations. The clustering analysis was constructed using the unweighted pair group method with arithmetic mean (UPGMA) algorithm. A cluster of invasive GAS isolates with the emm106 gene that exhibited a similarity of 85% are shown boxed (in the rectangle outlined by a broken line). Streptococcus pyogenes ATCC 12344 was used as a control strain.

