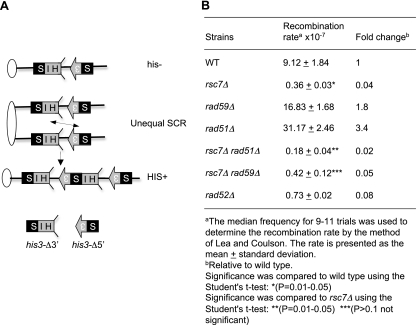
Fig. 8.
Rsc7 is required for unequal SCR. (A) Schematic representation of the unequal SCR assay. Ovals represent centromeres, and lines represent chromosomes. Arrows and boxes denote HIS3, S3 represents the 5′ deletion, and HIS represents the 3′ deletion. The region of homology is shown in black. (B) Unequal SCR rates were determined by dividing the number of HIS+ colonies in an SC plate without histidine with that in YEPD. The recombination rate was estimated by the method of Lea and Coulson (28).

